Dunning–Kruger effect
邓宁-克鲁格效应
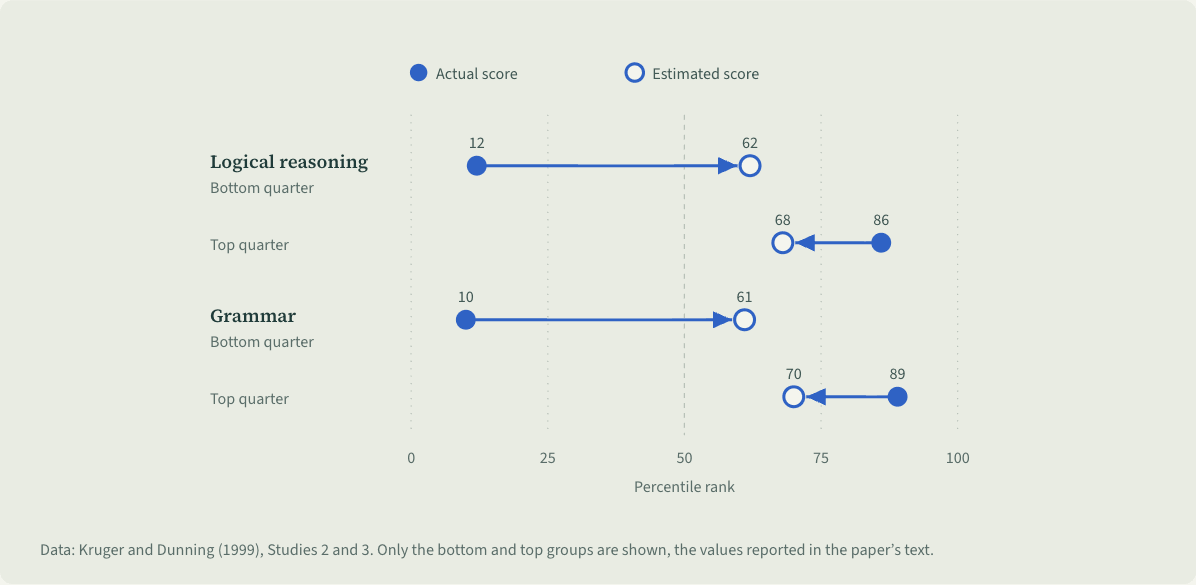
The Dunning–Kruger effect is the finding that people who perform poorly on a task tend to overestimate their ability and score by a wide margin, while top performers tend to underestimate theirs, by a smaller margin.[1][2]
Data: Kruger and Dunning (1999), Studies 2 and 3. Only the bottom and top groups are shown, the values reported in the paper’s text.
A horizontal dot chart with percentile rank from 0 to 100. In the logic study, the bottom quarter scored at the 12th percentile and estimated the 62nd; the top quarter scored at the 86th and estimated the 68th. In the grammar study, the bottom group scored at the 10th and estimated the 61st; the top group scored at the 89th and estimated the 70th. Arrows run from actual to estimated score.
 Save as image (PNG)
Key points
- In 1999 Justin Kruger and David Dunning tested Cornell undergraduates on humor, logical reasoning and grammar, then asked them to estimate their percentile rank.[1]
- In the logical-reasoning study, the bottom quarter scored at the 12th percentile on average but placed their own score near the 62nd.[1]
- The authors argued that low scorers lack the metacognitive skill needed to spot their own mistakes, while top scorers assume others did as well as they did.[1][2]
- Later analyses showed that regression to the mean and the common better-than-average bias can produce much of the same pattern, so the effect’s true size is debated.[3][4]
An example
Lin takes a spreadsheet quiz at work and expects to land in the top 40 percent. She ends up in the bottom 20 percent. The questions she got wrong without noticing are the same gaps that kept her from judging her own score.
Misreadings and limits
The viral “Mount Stupid” curve, with a peak of confidence, a valley of despair and a slope of enlightenment, is not from the paper. The study compared self-estimates with actual ranks across four score groups; in the logic and grammar studies, top scorers still rated themselves above bottom scorers.[1]
Sources
- 1 Kruger, J., & Dunning, D. (1999). Unskilled and unaware of it: How difficulties in recognizing one's own incompetence lead to inflated self-assessments. Journal of Personality and Social Psychology, 77(6), 1121–1134. doi:10.1037/0022-3514.77.6.1121
- 2 陈彦君, 石伟, & 应虎 (2013). 能力的自我评价偏差:邓宁-克鲁格效应. 心理科学进展, 21(12), 2204–2213. doi:10.3724/SP.J.1042.2013.02204
- 3 Gignac, G. E., & Zajenkowski, M. (2020). The Dunning-Kruger effect is (mostly) a statistical artefact: Valid approaches to testing the hypothesis with individual differences data. Intelligence, 80, Article 101449. doi:10.1016/j.intell.2020.101449
- 4 Nuhfer, E., Fleisher, S., Cogan, C., Wirth, K., & Gaze, E. (2017). How random noise and a graphical convention subverted behavioral scientists' explanations of self-assessment data: Numeracy underlies better alternatives. Numeracy, 10(1), Article 4. doi:10.5038/1936-4660.10.1.4
Last checked against sources: October 26, 2026