Brain waves
脑电波
What are brain waves?
Brain waves are the rhythmic electrical activity an electroencephalogram (EEG) picks up through scalp electrodes, mostly the summed, synchronized firing of many cortical neurons.[1] Clinicians sort them by frequency into bands, from slow delta through theta, alpha and beta to fast gamma.[2]
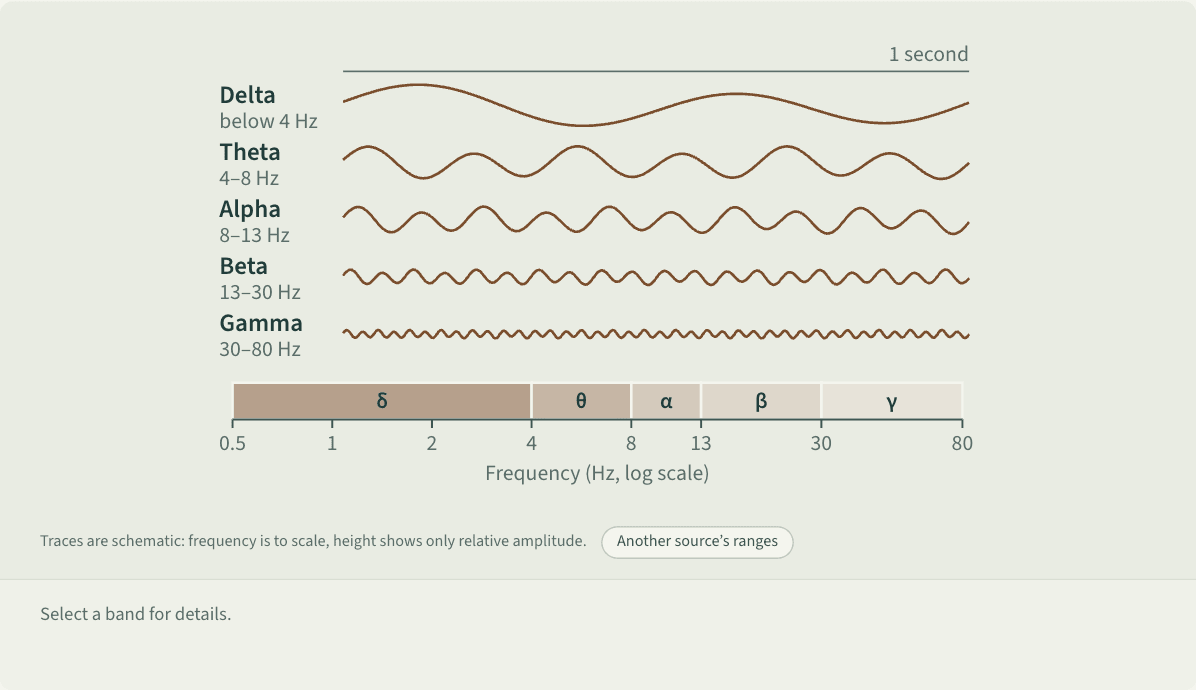
Traces are schematic: frequency is to scale, height shows only relative amplitude.
A log-scale frequency axis from 0.5 to 80 Hz divided into five segments: delta (below 4 Hz), theta (4–8 Hz), alpha (8–13 Hz), beta (13–30 Hz) and gamma (30–80 Hz). Above each segment is a one-second sample trace that gets denser and shorter from left to right: about 2 large waves per second for delta, 6 for theta, 10 for alpha, 20 small waves for beta and 40 tiny ones for gamma. Selecting a segment explains it: delta dominates deep N3 sleep in adults and signals brain dysfunction in an awake adult; theta rises with drowsiness and light sleep; alpha is clearest at the back of the head in relaxed, eyes-closed wakefulness and fades with eye opening or mental effort; beta is common over the front and center of the head when awake and increases with sedatives; gamma is mostly recorded inside the skull and is linked to sensory processing and cognition. A button shows another source’s ranges, whose edges differ by about 1 Hz.
 Save as image (PNG)
This figure image is licensed CC BY 4.0: reuse it with credit and a link back to this page. How to reuse
Key points
- A clinical EEG glossary sets delta below 4 Hz, theta at 4–8, alpha at 8–13, beta at 13–30 and gamma at 30–80 Hz; other sources draw the edges slightly differently.[1][2]
- Alpha waves peak at the back of the head during relaxed, eyes-closed wakefulness and fade with open eyes or mental effort.[2] Hans Berger described them in reports from 1929 on.[3]
- Beta appears over the front and center of the head when awake; theta rises with drowsiness and light sleep; slow delta dominates deep N3 sleep; gamma is mostly recorded inside the skull.[1][2]
- Binaural beats, tones differing slightly between the ears, are said to pull brain waves into a chosen band. Of 14 studies in a systematic review, 5 supported this and 8 did not.[4]
An example
Jay takes part in an EEG study. Sitting with his eyes closed, the electrodes at the back of his head pick up regular alpha waves. When he opens his eyes, they shrink, and they fade again when he does mental arithmetic with eyes closed. What researchers read from this is how awake and attentive he is at that moment.[2]
Misreadings and limits
Some charts map beta, alpha, theta and delta onto levels of consciousness and say certain waves let you enter the subconscious. Clinical definitions set bands by frequency alone, and meaning depends on context: delta is normal in deep sleep but signals brain dysfunction in an awake adult, and sedatives increase beta, often billed as the anxious wave.[1][2]
Sources
- 1 Nayak, C. S., & Anilkumar, A. C. (2025). Normal EEG waveforms. StatPearls. StatPearls Publishing (last update August 3, 2025). View source
- 2 Kane, N., Acharya, J., Beniczky, S., Caboclo, L., Finnigan, S., Kaplan, P. W., Shibasaki, H., Pressler, R., & van Putten, M. J. A. M. (2017). A revised glossary of terms most commonly used by clinical electroencephalographers and updated proposal for the report format of the EEG findings. Revision 2017. Clinical Neurophysiology Practice, 2, 170–185 (corrigendum: 4, 133, 2019). doi:10.1016/j.cnp.2017.07.002
- 3 Caeira, M. W., Caboclo, L. O., & de Paola, L. (2023). An appraisal to Hans Berger by the time of his 150th birthday: The human EEG and tales of blood flow, heat and brain waves. Arquivos de Neuro-Psiquiatria, 81(12), 1163–1168. doi:10.1055/s-0043-1777114
- 4 Ingendoh, R. M., Posny, E. S., & Heine, A. (2023). Binaural beats to entrain the brain? A systematic review of the effects of binaural beat stimulation on brain oscillatory activity, and the implications for psychological research and intervention. PLOS ONE, 18(5), e0286023. doi:10.1371/journal.pone.0286023
Last checked against sources: October 27, 2026