Happiness pie (50-10-40)
幸福饼图(50-10-40)
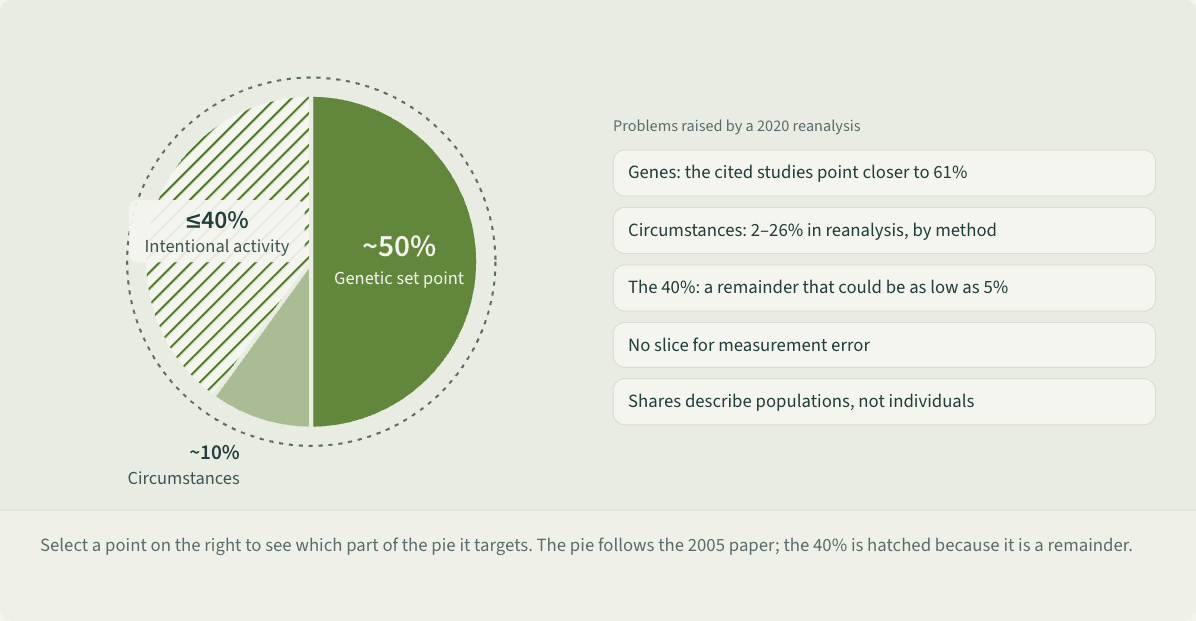
The happiness pie comes from a 2005 paper by psychologist Sonja Lyubomirsky and colleagues: differences in happiness between people were attributed about 50% to a genetic set point, about 10% to life circumstances, and up to 40% to intentional activities.[1]
Problems raised by a 2020 reanalysis
On the left, a pie chart: genetic set point about 50%, circumstances about 10%, intentional activity up to 40%, the last slice hatched. A dashed ring around the pie stands for the population. On the right, five problems raised by a 2020 reanalysis; selecting one highlights the part of the pie it concerns: the cited studies put the genetic share closer to 61%; the reanalysis put circumstances at 18–26% (2–18% when cross-validated); the 40% is a remainder that could be as low as 5% with equally plausible inputs; there is no slice for measurement error; and the shares describe differences across a population, cannot be turned into how much one person can change, and do not simply add up.
 Save as image (PNG)
Key points
- The shares are not results from one study. The authors assembled approximate figures from earlier research, and they describe sources of variation across a population.[1]
- The 40% is what remains after subtracting the genetic and circumstance shares from 100%; the authors framed it as room for intentional activity to matter.[1]
- The authors argued circumstances matter little because people adapt to stable conditions, while varied intentional activities resist adaptation; see Hedonic adaptation.[1]
- Lyubomirsky later said the chart has been “widely misinterpreted,” while still holding that people can intentionally improve their well-being.[3]
An example
Lin sees a post claiming “40% of your happiness is in your hands” and fills her week with gratitude journaling and meditation. The chart actually describes where differences between people come from; it cannot be converted into how much one person can change.
Misreadings and limits
A 2020 reanalysis found little evidence for the pie. Variance shares describe populations, not individuals; genes, circumstances and behavior intertwine rather than add up; the model ignores measurement error; and with equally plausible inputs the “40%” could be as low as 5%.[2]
Sources
- 1 Lyubomirsky, S., Sheldon, K. M., & Schkade, D. (2005). Pursuing happiness: The architecture of sustainable change. Review of General Psychology, 9(2), 111–131. doi:10.1037/1089-2680.9.2.111
- 2 Brown, N. J. L., & Rohrer, J. M. (2020). Easy as (happiness) pie? A critical evaluation of a popular model of the determinants of well-being. Journal of Happiness Studies, 21(4), 1285–1301. doi:10.1007/s10902-019-00128-4
- 3 Lyubomirsky, S. (2019). Revisiting the happiness pie chart: The science of interventions aimed at increasing well-being. 6th World Congress on Positive Psychology, International Positive Psychology Association (plenary abstract #384). View source
Last checked against sources: October 26, 2026