Bodily maps of emotions
情绪的身体地图
What are bodily maps of emotions?
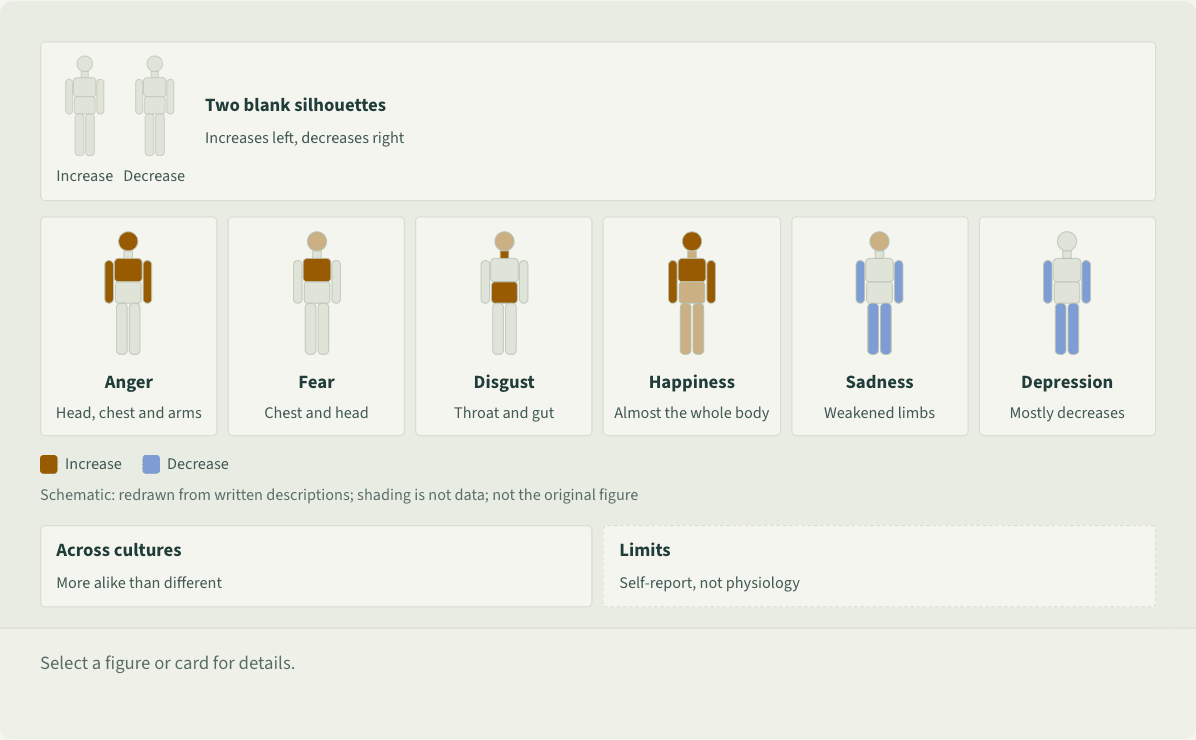
Bodily maps of emotions come from a 2014 study by Lauri Nummenmaa and colleagues. While viewing emotion words, stories, films or faces, 701 participants colored two blank silhouettes where they felt activity rising or falling; pooled, each emotion showed a distinguishable pattern.[1]
Increase Decrease Schematic: redrawn from written descriptions; shading is not data; not the original figure
Schematic, top to bottom. A card at the top shows two blank silhouettes side by side, labeled increase and decrease: participants colored where they felt activity rise on the left figure and fall on the right. Below are six small figures, one per emotion. Anger: head, chest and arms warm. Fear: chest and head warm. Disgust: throat and belly warm. Happiness: nearly the whole body warm. Sadness: head lightly warm, limbs cool. Depression: like sadness, limbs cool and no warm areas. A legend gives warm for increase and cool for decrease and notes that the drawing follows written descriptions. Two cards at the bottom: culture, with very similar maps across Finland, Sweden and Taiwan and broad agreement in a 101-country online study; and limits, since the maps come from self-report, not physiological measurement.
 Save as image (PNG)
This figure image is licensed CC BY 4.0: reuse it with credit and a link back to this page. How to reuse
Key points
- Most basic emotions were felt in the upper chest. Anger and happiness showed in the arms, sadness as weakened limbs, disgust in the throat and gut, and happiness across the whole body.[1]
- Finnish, Swedish and Taiwanese groups, answering in their own languages, drew very similar maps.[1] A 2020 online study of 3,954 people from 101 countries agreed, though it had few East Asians.[2]
- A 2018 study mapped 100 feelings, from thinking to hunger. Nearly all had a distinct bodily pattern; the more one was felt in the body, the more salient it was in mind.[3]
- Among 98 Chinese university students, maps for happiness, love, fear and anxiety also differed. Interviews showed the coloring captured thoughts, feelings and urges to act, not only physical changes.[4]
An example
In an emotion-skills class, Jay recalls last week’s fight with his roommate and colors a body outline: red where he feels heat or tension, blue where he feels heavy or drained. He reddens his face, chest and clenched hands. The teacher notes that the drawing shows what he feels, not his temperature or a test result.
Misreadings and limits
Because they look like thermal images, the maps are often taken as measured body heat or physiology. They pool what people report feeling: the original authors say the maps cannot establish the underlying physiology,[1] a 2020 follow-up calls them subjective feeling maps,[2] and people interpret “increase” and “decrease” differently.[4]
Sources
- 1 Nummenmaa, L., Glerean, E., Hari, R., & Hietanen, J. K. (2014). Bodily maps of emotions. Proceedings of the National Academy of Sciences, 111(2), 646–651. doi:10.1073/pnas.1321664111
- 2 Volynets, S., Glerean, E., Hietanen, J. K., Hari, R., & Nummenmaa, L. (2020). Bodily maps of emotions are culturally universal. Emotion, 20(7), 1127–1136. doi:10.1037/emo0000624
- 3 Nummenmaa, L., Hari, R., Hietanen, J. K., & Glerean, E. (2018). Maps of subjective feelings. Proceedings of the National Academy of Sciences, 115(37), 9198–9203. doi:10.1073/pnas.1807390115
- 4 朴虹, 张歆磊, & 严文华 (2022). 情绪的身体感觉:基于身体感觉地图(BSMs)与主观报告. 心理科学, 45(6), 1483–1491. View source
Last checked against sources: October 28, 2026