Genogram
家谱图
What is a genogram?
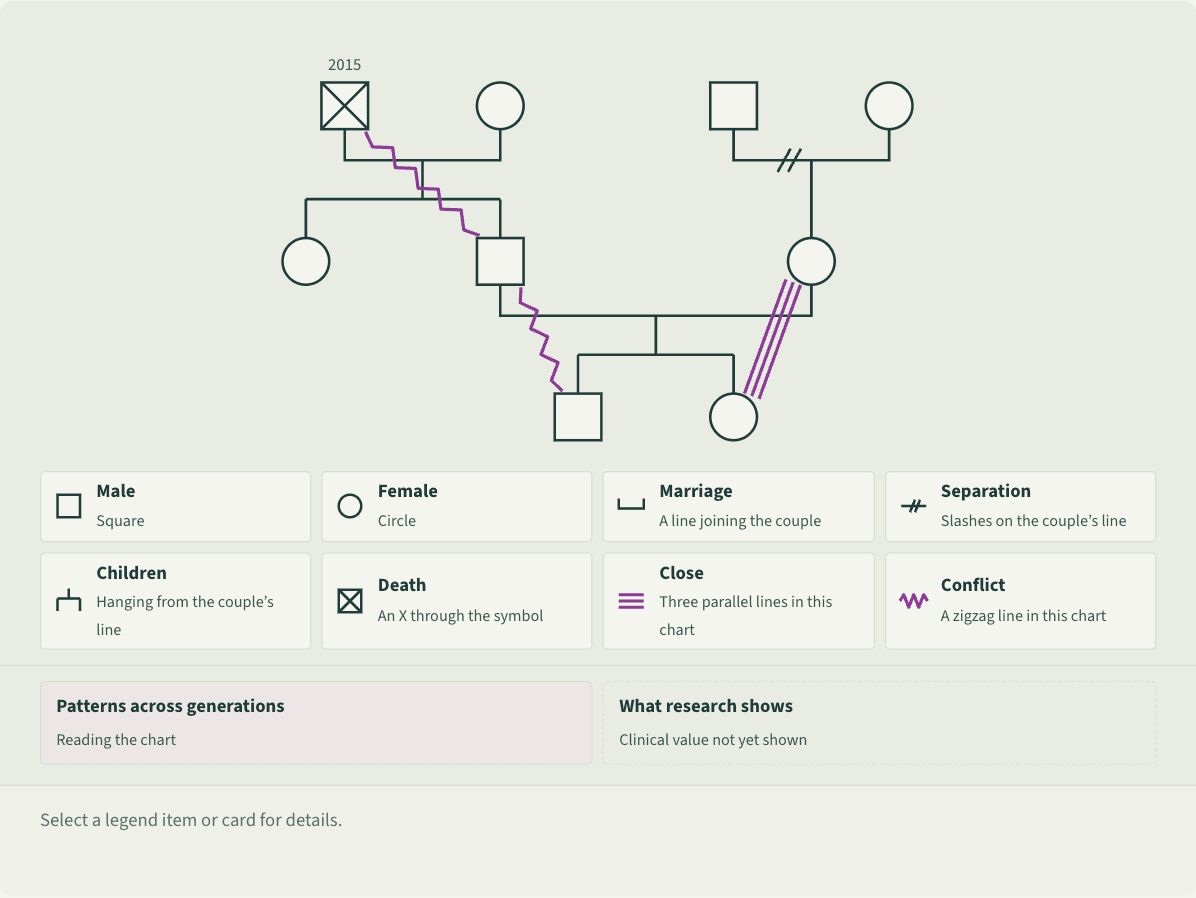
A genogram is a family diagram drawn with conventional symbols, usually covering three generations. It records family history such as births, marriages, illness and deaths, and also how members relate, such as closeness or conflict.[1][3] It grew out of Bowen’s family systems theory and is used to spot patterns that recur across generations.[1][2]
Schematic of a three-generation genogram for a fictional family. In the first generation, on the left, the paternal grandfather (a square with an X through it, marked died 2015) and grandmother (a circle); on the right, the maternal grandfather (square) and grandmother (circle), whose connecting line carries two slashes to show they separated. In the second generation, two children hang from the paternal grandparents’ line: an aunt (circle) on the left and the father (square) on the right; the mother (circle) hangs from the maternal grandparents’ line. The father and mother are joined by a line, and from it hang the third generation: an older brother (square) on the left and a younger sister (circle) on the right. Three colored relationship lines are added: zigzag lines for conflict between the grandfather and father and between the father and son, and three parallel lines for a close bond between the mother and daughter. Below is a legend (male, female, marriage, separation, children, death, close, conflict) and two cards: patterns across generations, and what research shows.
 Save as image (PNG)
This figure image is licensed CC BY 4.0: reuse it with credit and a link back to this page. How to reuse
Key points
- Bowen introduced such diagrams in the 1970s, calling them family diagrams; McGoldrick and Gerson’s 1985 book popularized genograms.[2]
- Conventions: squares for males, circles for females, a line joining each couple, children hanging below with the eldest on the left, and an X through anyone who has died.[3]
- In family therapy the family can draw it together to build rapport, spot triangles and other patterns and plan treatment; it suits individual therapy too.[3] Family doctors use it for medical history.[4]
- In a randomized trial in family practice (189 patients), having a genogram made no difference to doctors’ understanding of patients or to patients’ views of the visit.[4]
An example
In a counseling class, Lin draws a three-generation genogram of her family. With the relationship lines in, she sees conflict between her grandmother and mother and between her mother and her, and all three are eldest daughters. Her teacher says this is worth exploring, but it does not mean conflict is inherited or that anyone is to blame.
Misreadings and limits
A genogram is not a genetic chart: a medical pedigree records kinship, illness and death, while a genogram also maps relationships.[1] Patterns across generations are a starting point for discussion, not a conclusion. Stagoll and Lang warn that a genogram is only a simulation of reality, and that drawing an elegant diagram is not the goal of therapy.[3]
Sources
- 1 American Psychological Association (2018). Genogram; Family systems theory; Pedigree. APA Dictionary of Psychology (entries updated April 19, 2018). View source
- 2 Amorin-Woods, D. (2024). Genograms, culture, love and sisterhood: A conversation with Monica McGoldrick. Australian and New Zealand Journal of Family Therapy, 45(3), 349–366. doi:10.1002/anzf.1602
- 3 Stagoll, B., & Lang, M. (1980). Climbing the family tree: Working with genograms. Australian Journal of Family Therapy, 1(4), 161–170. doi:10.1002/j.1467-8438.1980.tb00022.x
- 4 Rogers, J. C., & Rohrbaugh, M. (1991). The SAGE-PAGE trial: Do family genograms make a difference?. Journal of the American Board of Family Practice, 4(5), 319–326. View source
Last checked against sources: October 28, 2026